Gallery#
Here is a gallery of examples of figanos. Click on the examples to see how to generate these yourself.
Timeseries#
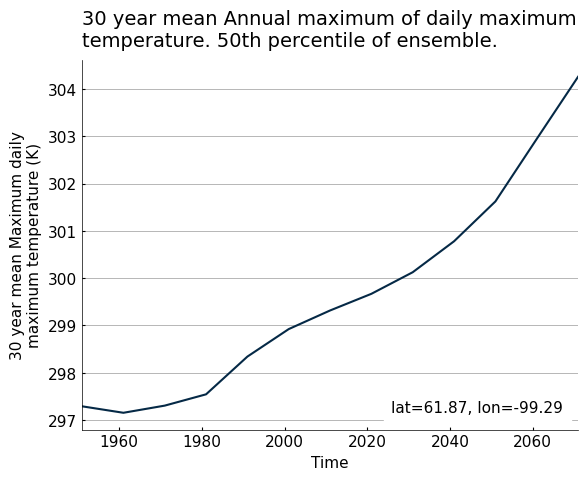
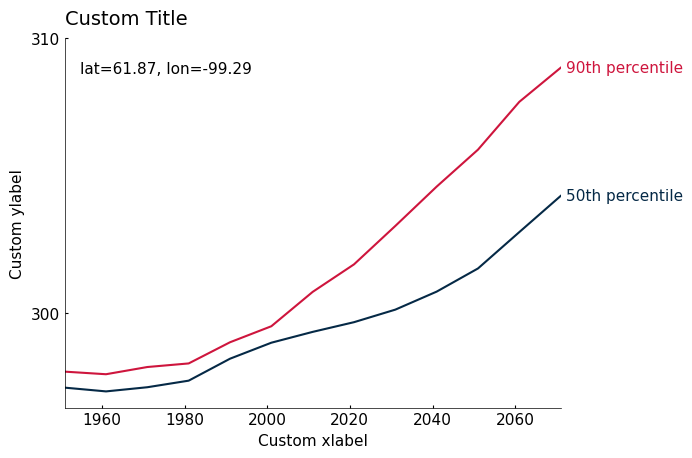
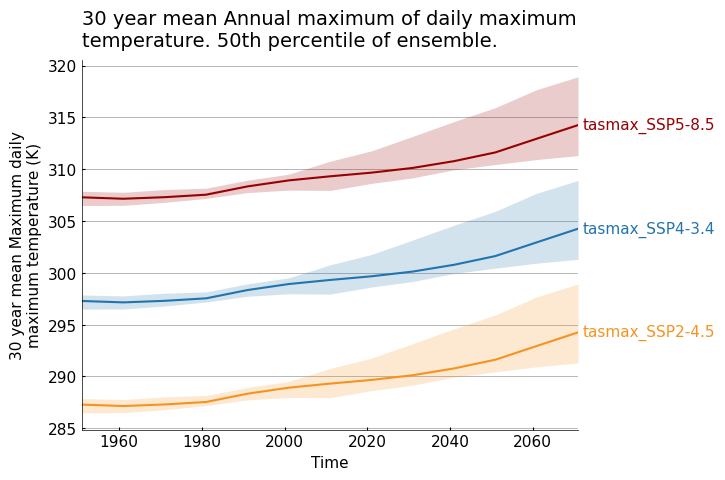
Full code example: Timeseries notebook.
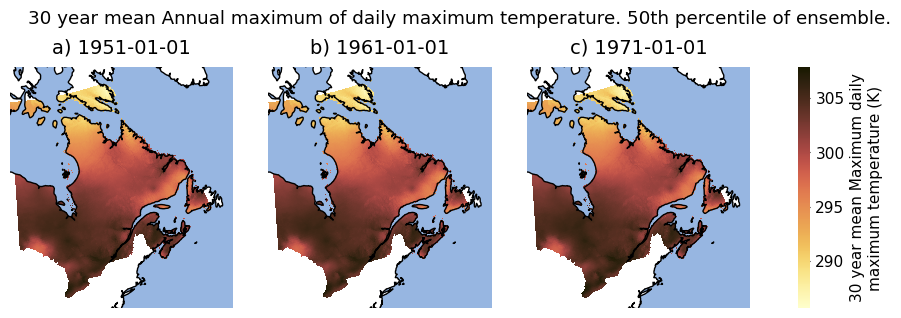
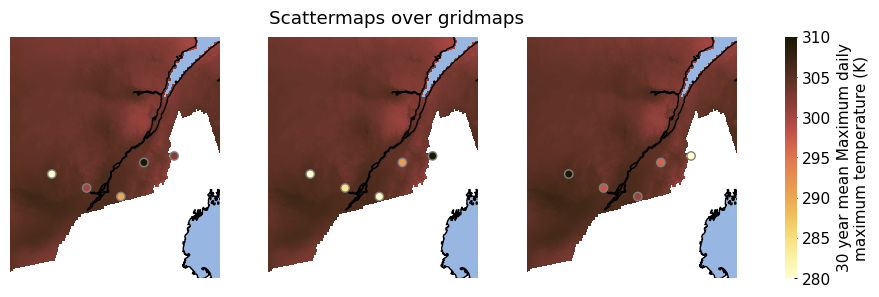
Maps#
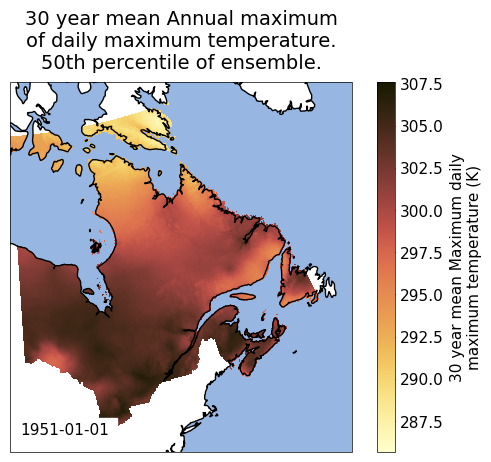
Gridded Data# |
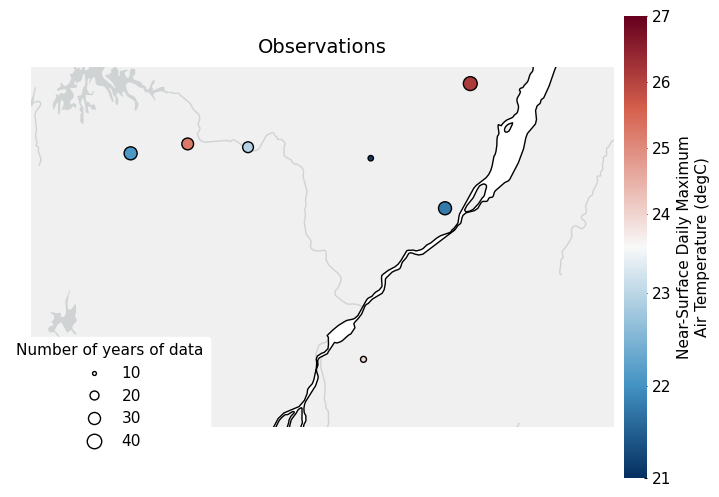
Station Data# |
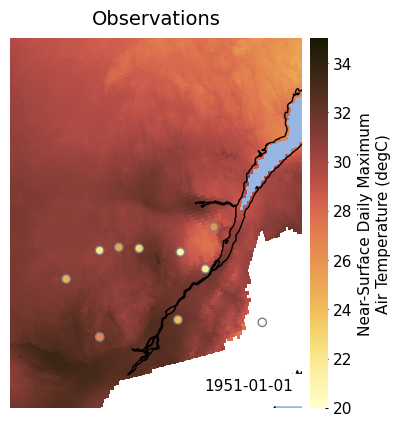
Mixed Gridded and Station Data# |
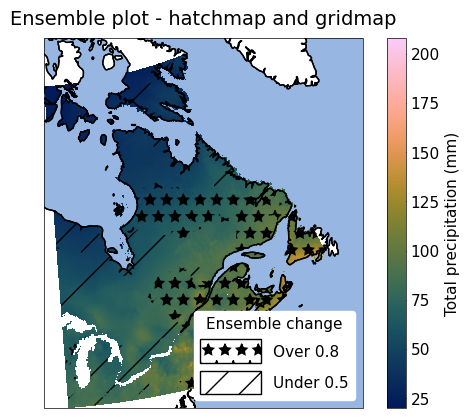
Hatching# |
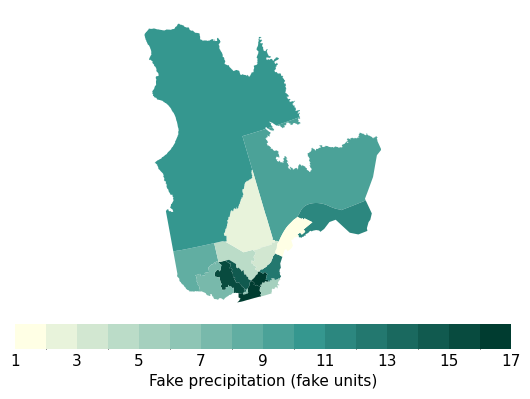
Choropleth using GeoDataFrames# |
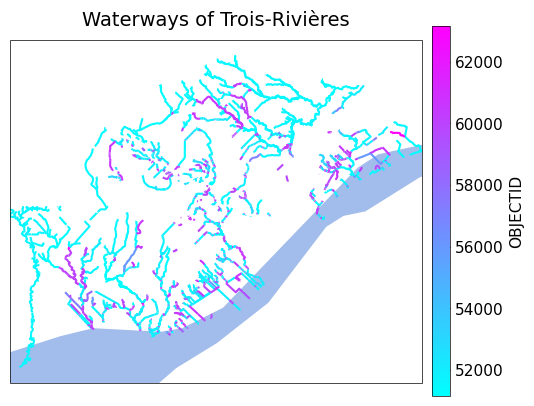
Categorized Features using GeoDataFrames# |
Full code example: Maps notebook.
Miscellaneous#
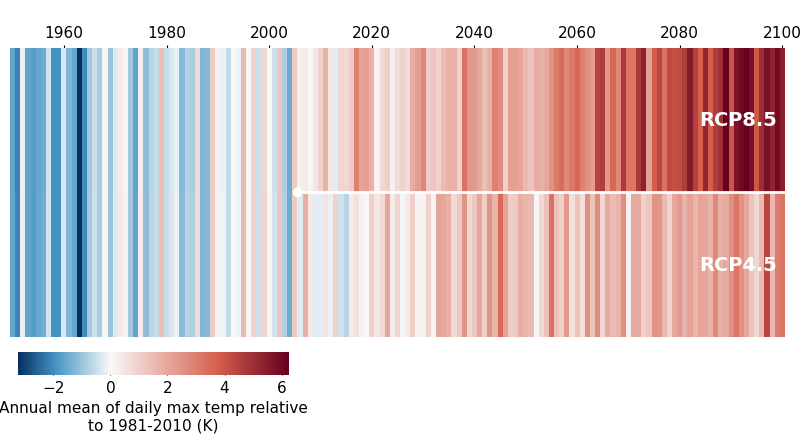
Climate Stripes# |
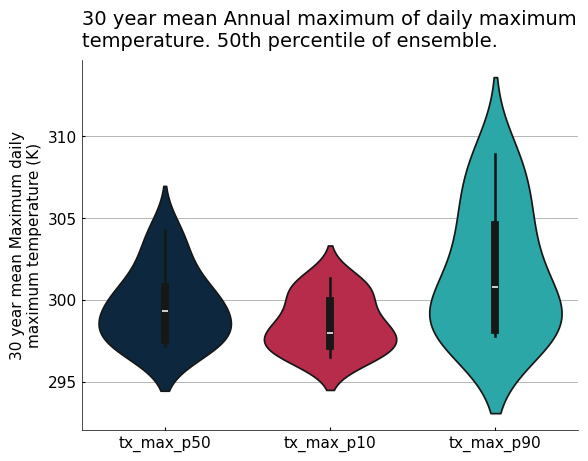
Violin Plots# |
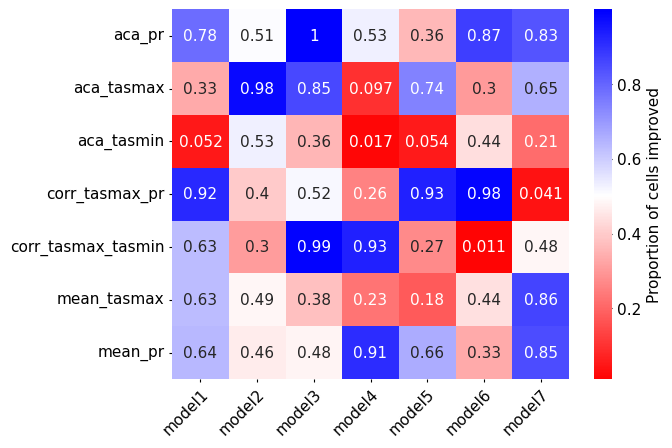
Heatmaps# |
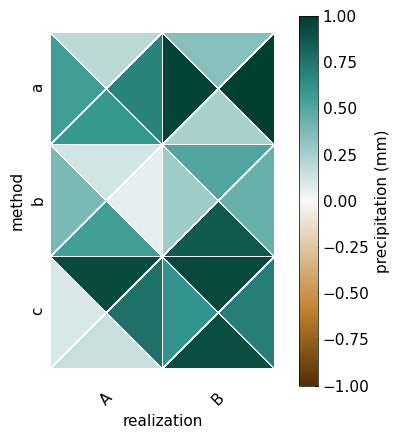
Triangle Heatmap (4)# |
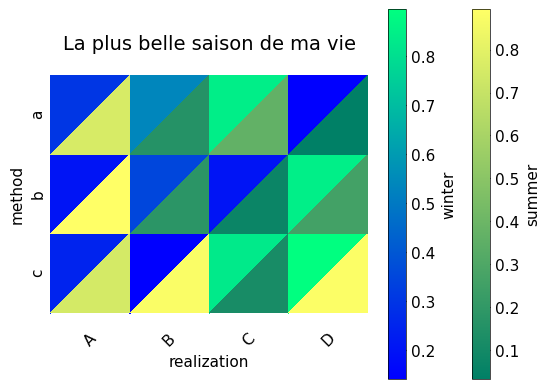
Triangle Heatmap (2)# |
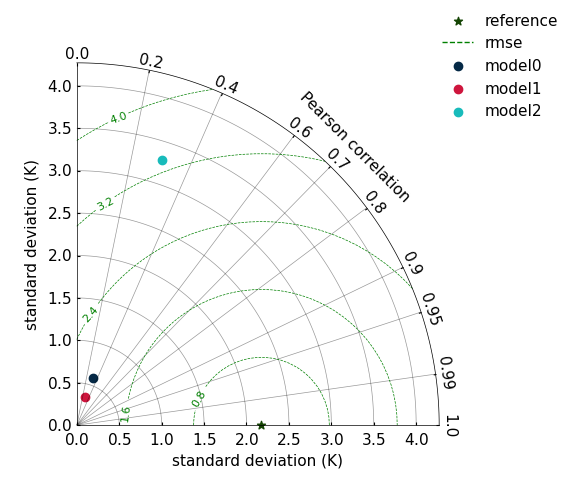
Taylor Diagrams# |
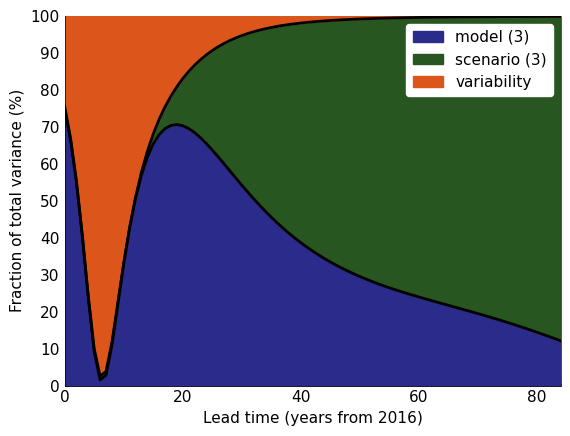
Partition Plots# |
Adding Logos# |
Full code example: Miscellaneous notebook.
Multiple Plots#
Full code example: Multiple plots notebook.